Clarity is a characteristic of effective signs. This is also true for one of the signs for the earth that was widely used in the medieval period: a circle divided by lines which distinguish Asia, Europe and Africa, known as a ‘T-O’ map because of its resemblance to those letters. While other medieval world maps divide the whole globe into climate zones, the focus in these T-O maps is simply on the then-known inhabited parts of the northern hemisphere which are configured to fill the entire space—like a modern pie chart that presents selected information from a complex pool of knowledge in a clear manner.
Maps in manuscripts of Isidore of Seville’s Etymologies
Such maps are found in many different contexts. The most prominent is the Etymologies by Isidore of Seville (b. c. 560, d. 636), which became one of the most widely consulted encyclopedic works in Europe during the medieval period. Almost a thousand manuscript copies of this text survive, and it was also one of the first texts to be printed in the West. In copies of the Etymologies, you will often find a T-O map near the beginning of Book 14. In this book Isidore described the earth as being located at the centre of the spherical cosmos and divided into three parts surrounded by the ocean (chapters 1–2), and then provided a detailed survey of these parts, beginning with Asia (chapter 3).
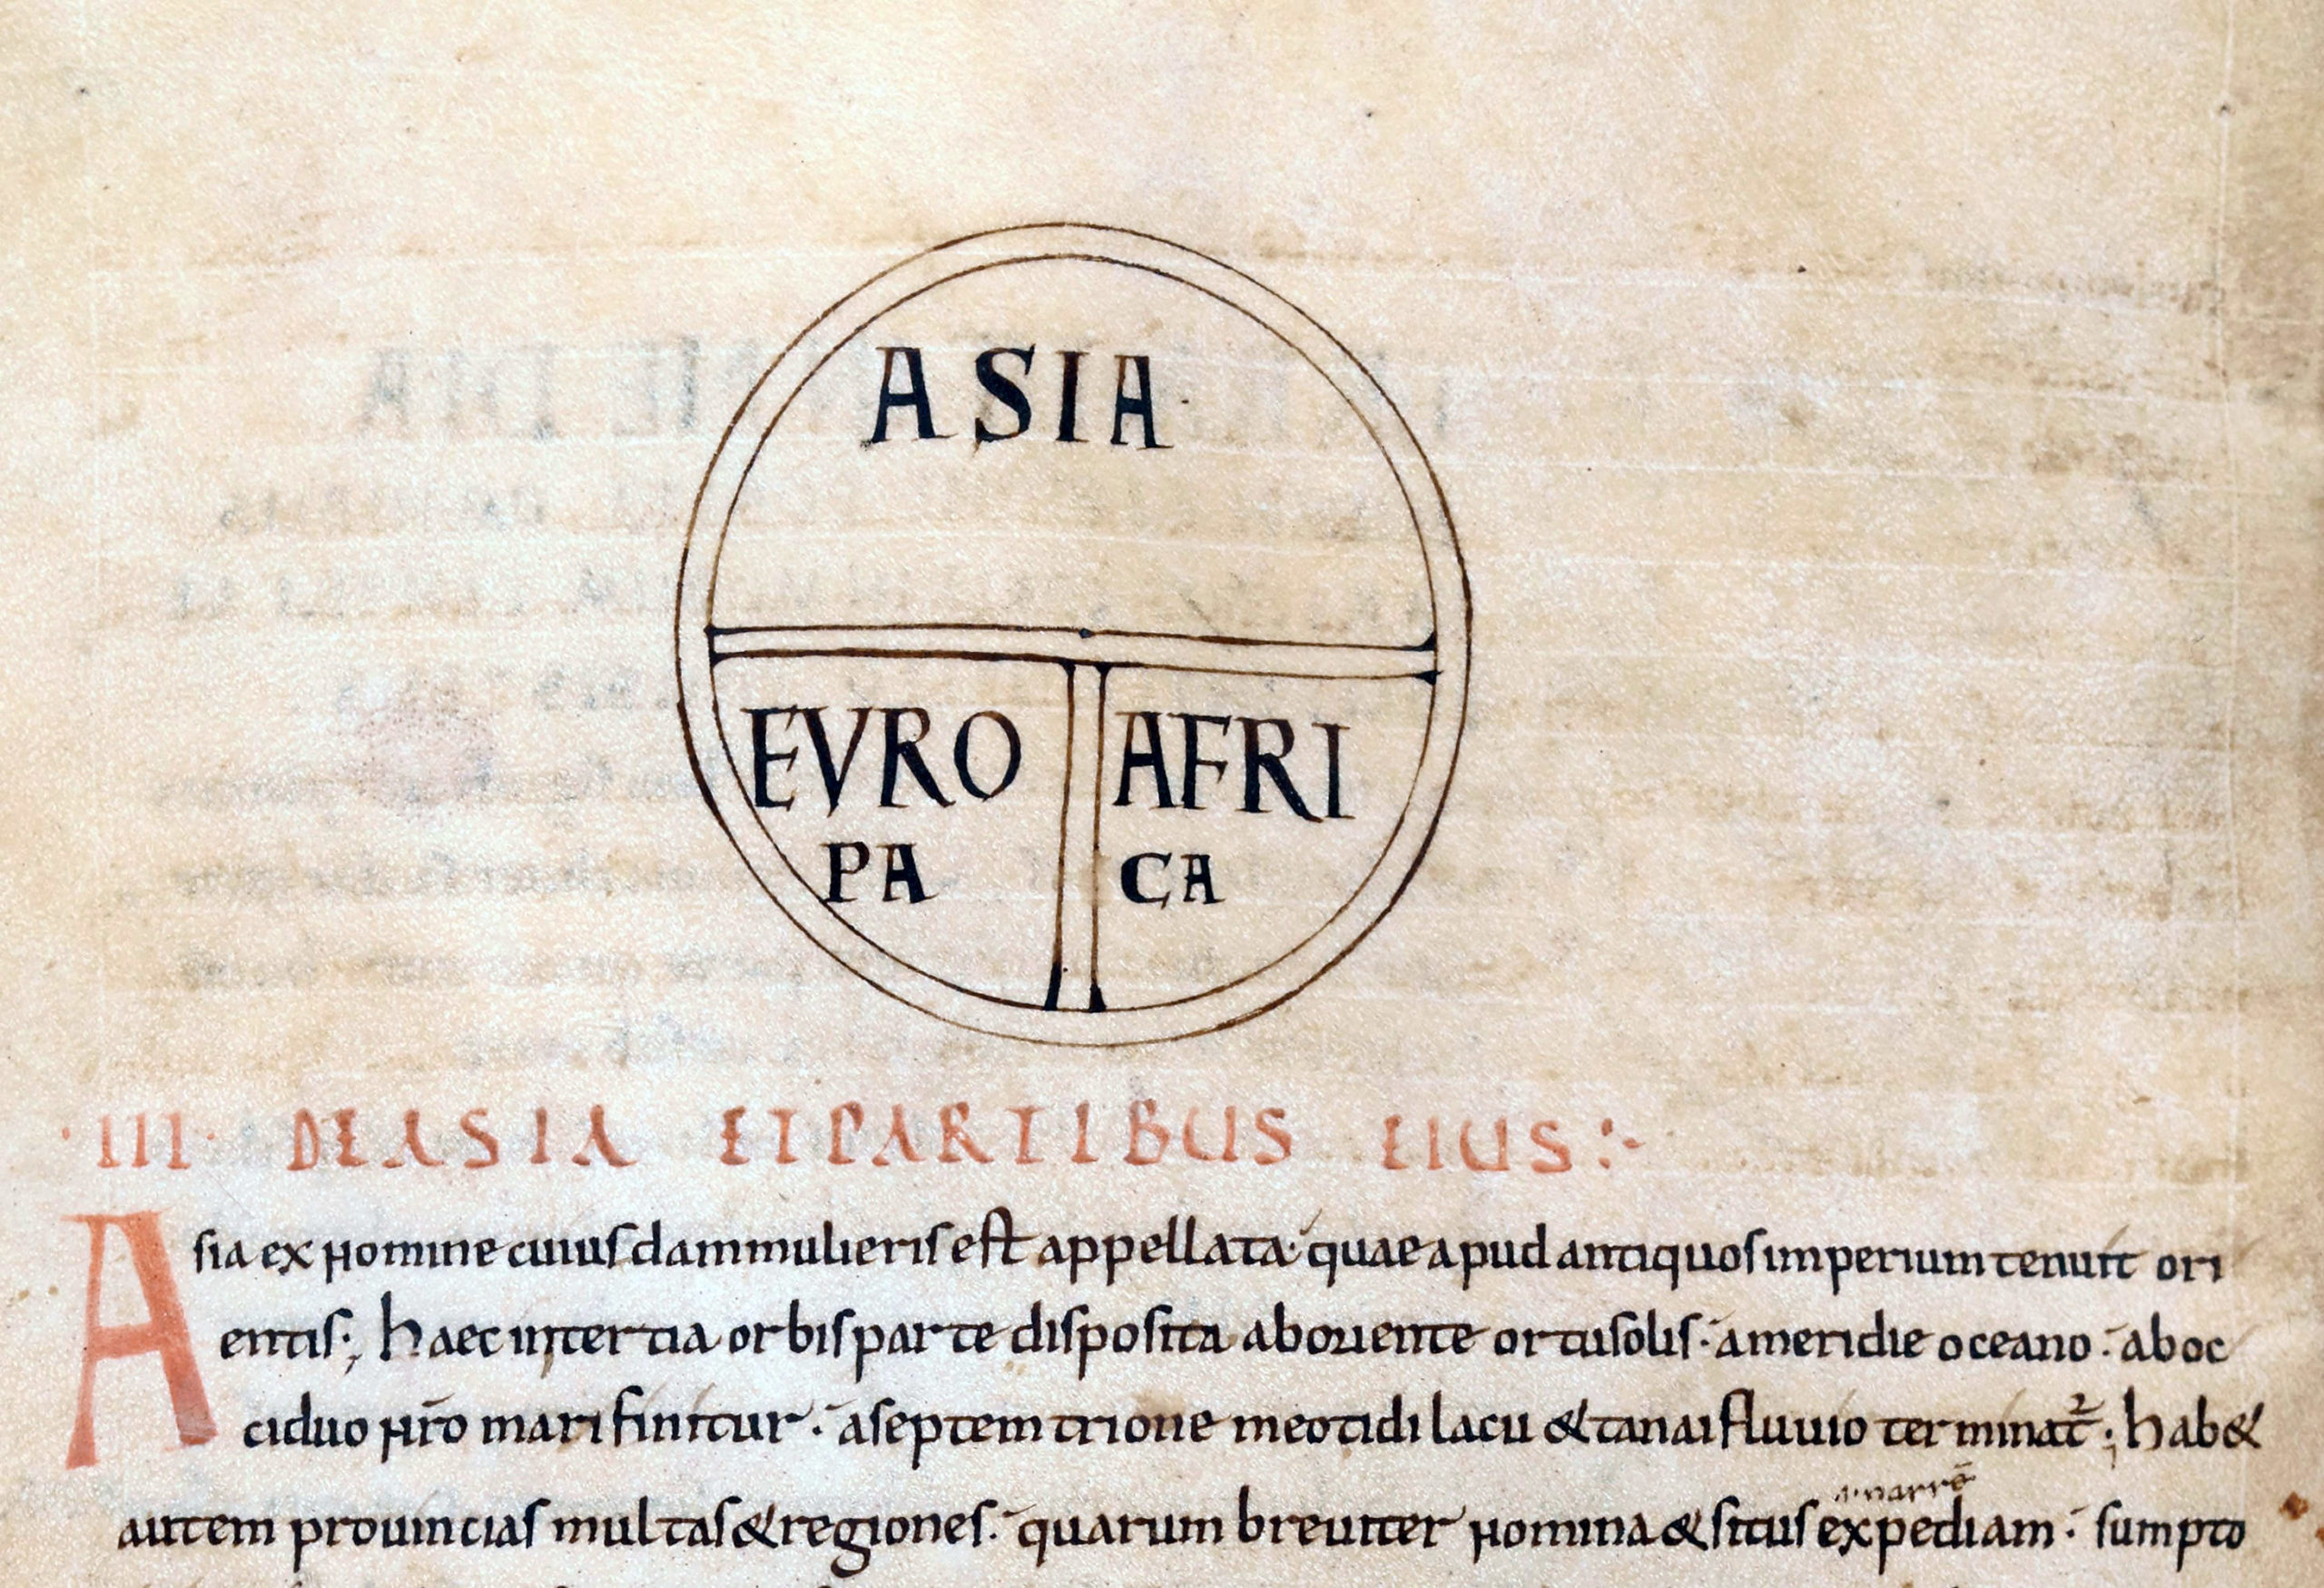
A T-O map from the Etymologies of Isidore of Seville, 10th century (BnF, Latin 7585, f. 164v, detail; The British Library)
A French and English copy of the text includes one of these maps (now BnF, Latin 7585). This manuscript was produced in northern France in the first half of the 10th century and then came to England, where missing portions (including the relevant section of Book 14) were added. In the map, the names of the three parts of the world are given in large display script. Double lines designate the ocean surrounding the parts of the earth and the waterways that separate them from one another. Because Isidore used geography to structure his survey of the world, readers could use the spatial framework provided by this T-O map as a tool to orientate themselves in his text and anchor in the mind the wealth of information he provided.
In other cases, the maps themselves are expanded to include further details. For example, in an early 11th-century French copy of the Etymologies (now BnF, Latin 7586), the four cardinal directions are indicated outside of the map. The horizontal dividing line is identified as the rivers Tanais (Don) and Nile, which divide Asia from Europe and from Africa. The Mediterranean between Europe and Africa is covered in dark brown while the surrounding ocean is left blank. The names of Noah’s sons Sem, Ham and Japhet are included in the map in the areas that were believed to have been populated by their descendants after the Great Flood (Genesis 9:18–19; Isidore, Etymologies, 9.2.2–37). This temporal dimension turned the drawn geographical space itself into a stage of history – a characteristic of many medieval maps.
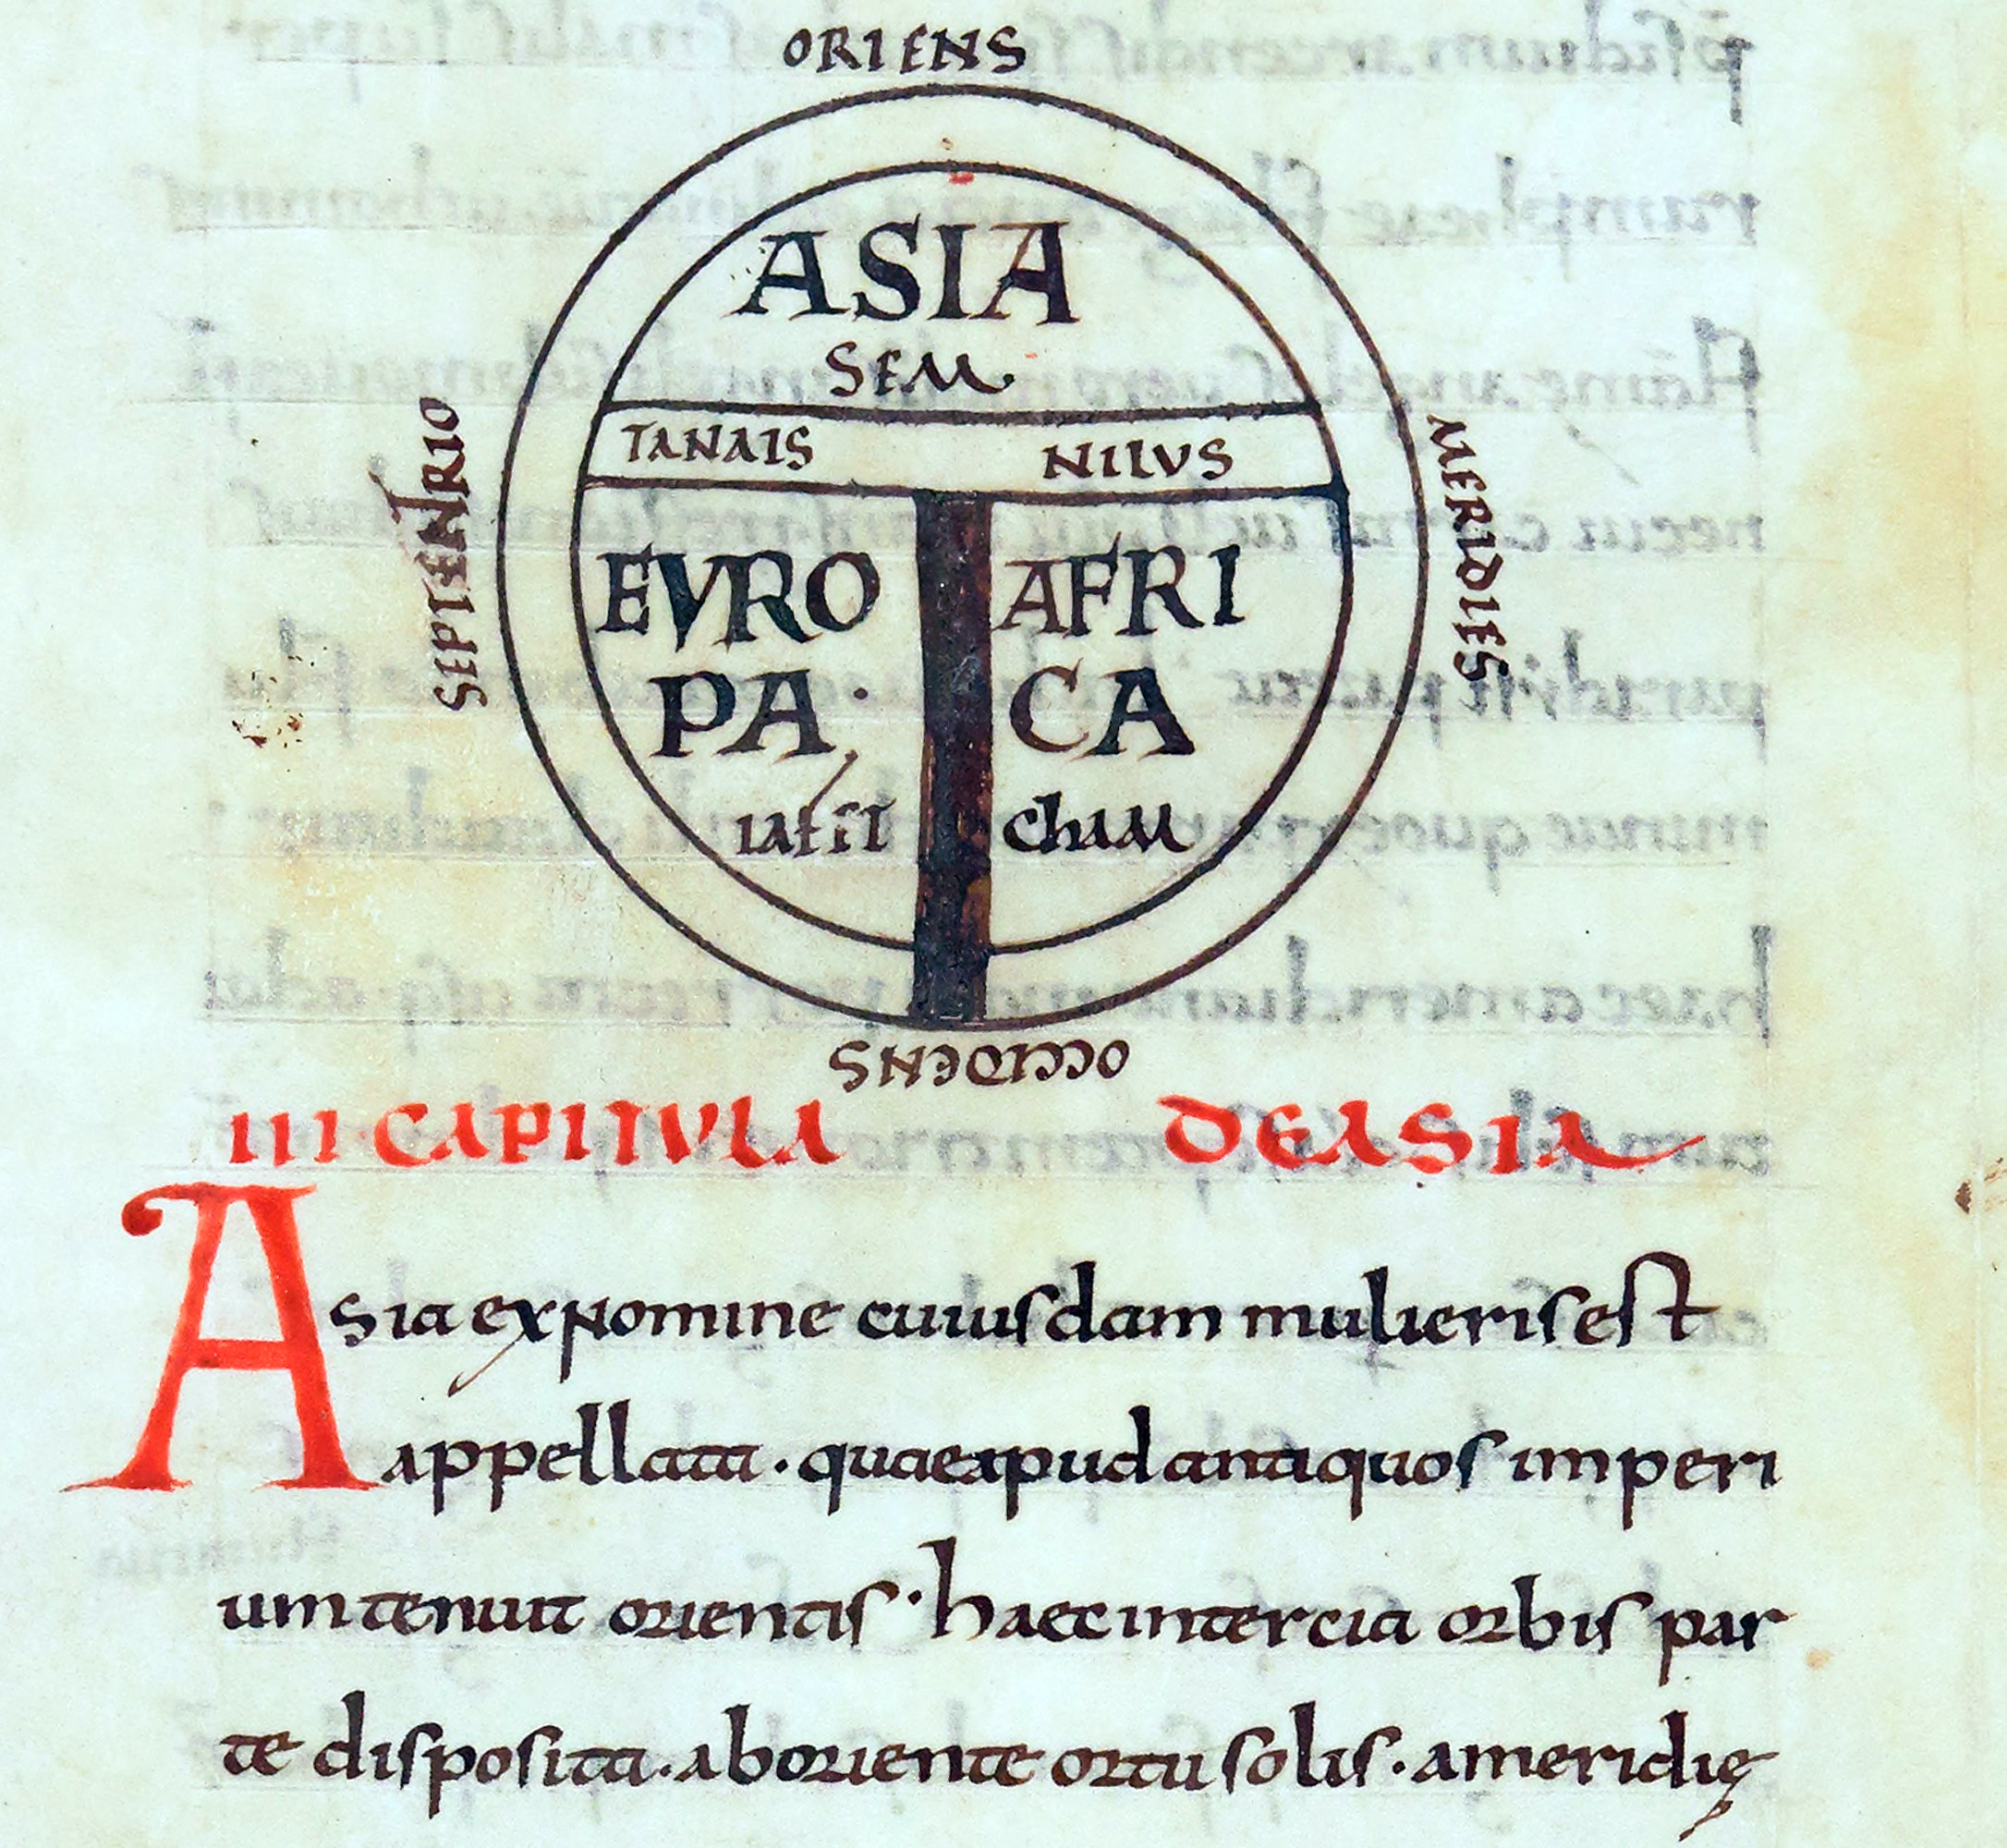
A T-O map with the four cardinal directions indicated outside of the map, from a French copy of the Etymologies of Isidore of Seville (BnF, Latin 7586, f. 45r, detail; The British Library)
A world map from Peterborough
Some of the best known medieval world maps are encyclopedic in themselves. One example was made in the Benedictine abbey of Peterborough c. 1122–35 (now British Library, Harley MS 3667). The manuscript now consists of just 10 leaves that are fragments of a larger computistical manuscript: together with other surviving leaves they contain tables, diagrams and texts relevant to the measurement of time and related areas of knowledge. Judging by the surviving parts, the manuscript’s contents derived, at least in part, from a lost manuscript that is thought to have been compiled by the Anglo-Saxon scholar Byrhtferth (fl. c. 986–c.1016) at the nearby Benedictine abbey of Ramsey. Byrhtferth, in turn, had been taught by Abbo of Fleury (b. 945/50, d. 1004), one of the foremost intellectuals of his age. Abbo came from the important Benedictine monastery of St Benoît-sur-Loire in Fleury to the newly founded house at Ramsey between 985 and 987, and made a vital contribution to the transfer of knowledge between France and England during this period of monastic reform.
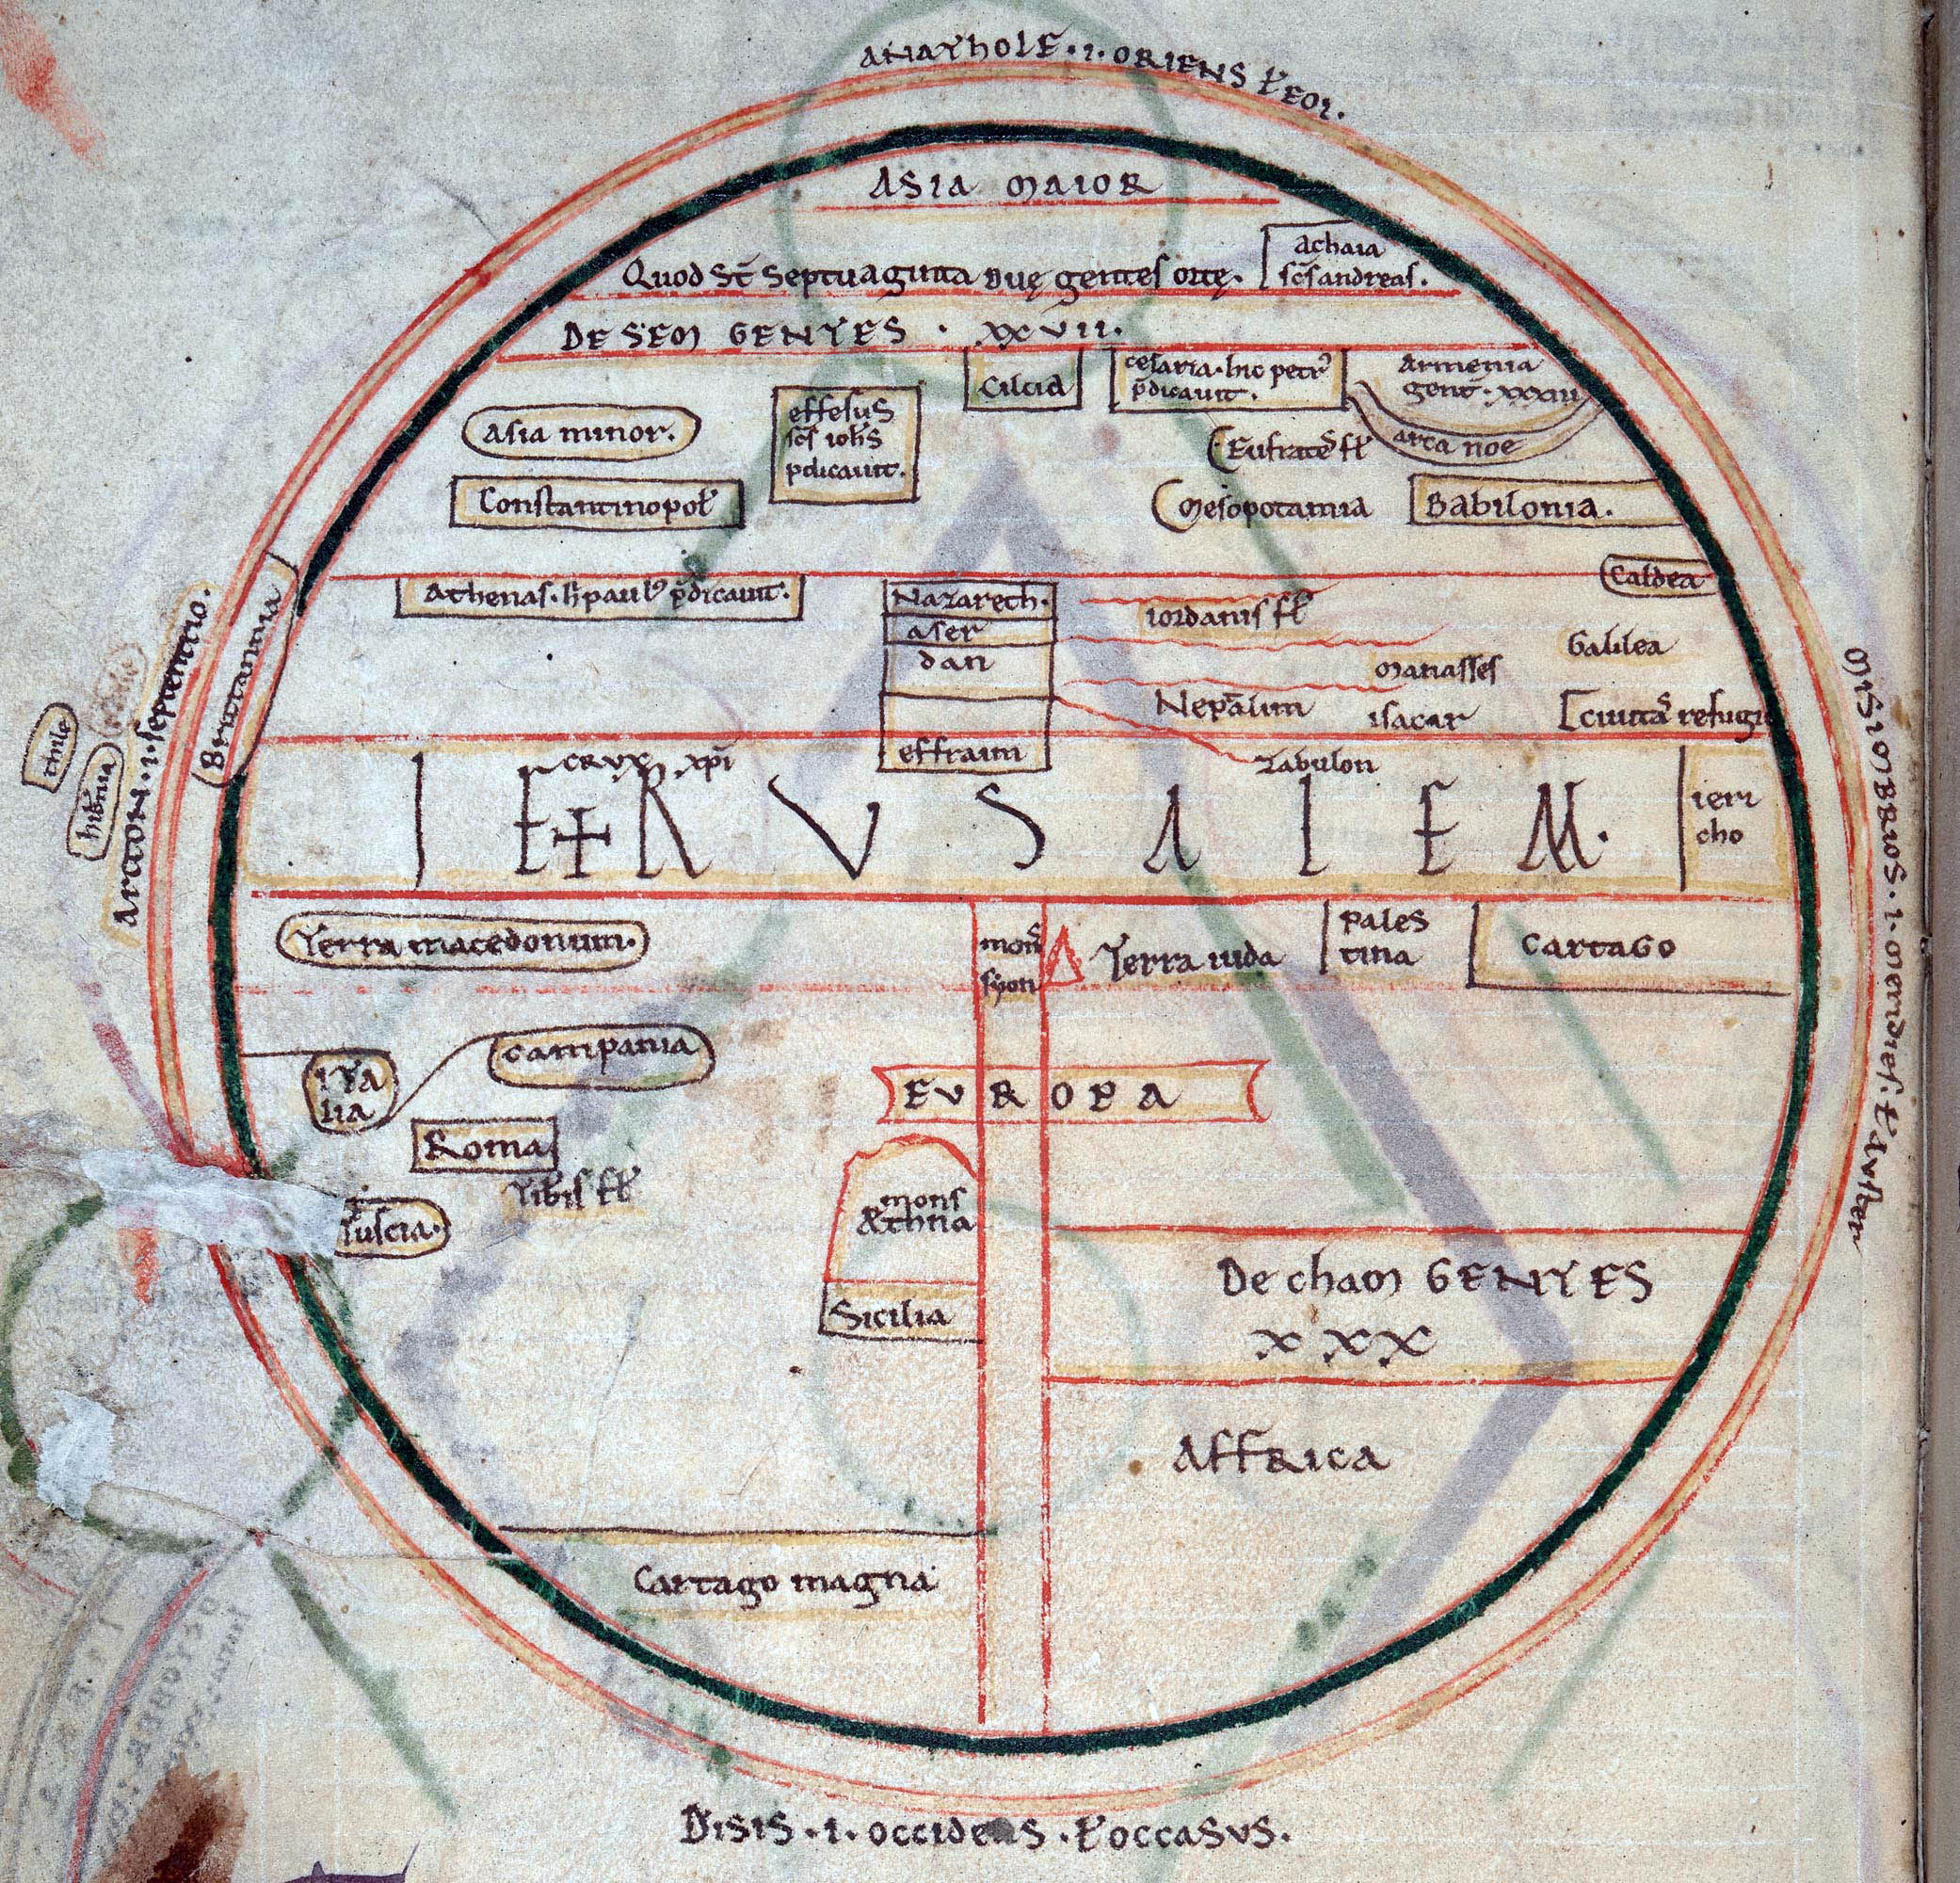
A map of the world using the T-O model, with some major cities and regions labelled, Computus collection including Byrhtferth of Ramsey’s diagram (British Library, Harley MS 3667, f. 8v, detail; The British Library)
In the Peterborough manuscript, the world map is positioned between a diagram thought to have been devised by Byrhtferth himself and a cosmological treatise by Abbo of Fleury. The diagram links the signs of the Zodiac, elements, months and days, solstices and equinoxes, seasons, ages of man, winds and directions of the compass. A similarity between the map and the diagram is that the directions of the compass are given not only in Latin (oriens (east), occidens (west), septentrio (north), meridies (south)) but also in transliterated Greek (anathole, disis, arcton, mesembrios). The first letters of each of the Greek words form the name ‘Adam’ when read in the form of the sign of the cross. More generally, the diagram, too, can be seen to map the world, but it extends from the level of man (the microcosm) to the level of the cosmos (the macrocosm). The primary emphasis here is not on the layout but on the composition of the world and the invisible network linking all its composite parts to one another. As such, it can symbolize a perfectly ordered universe created by God and governed by him until the end of time.
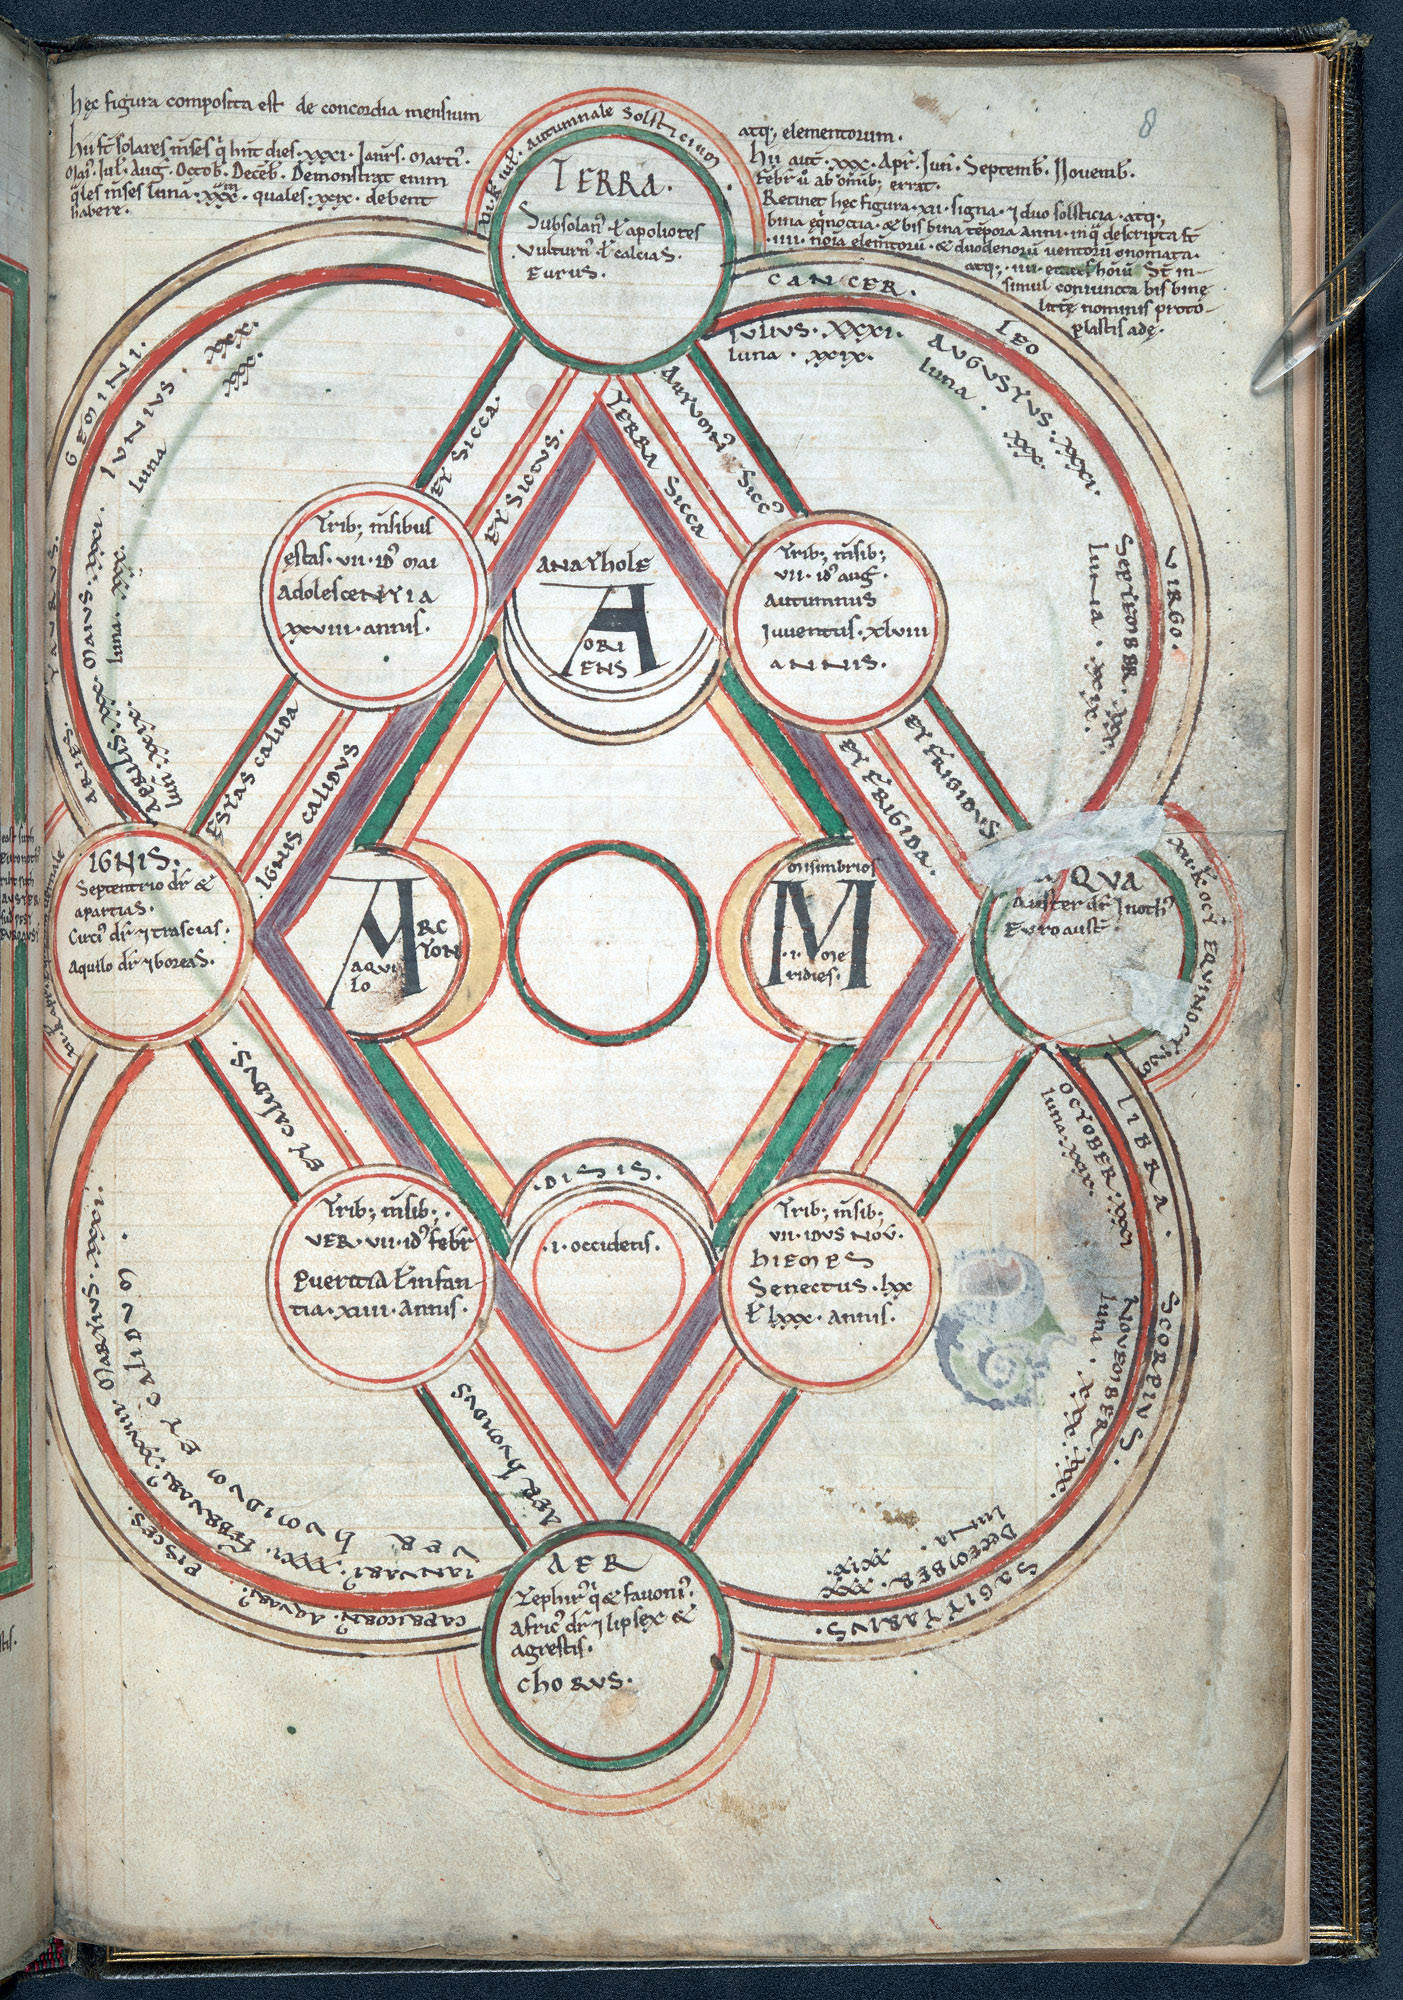
Byrthferth’s diagram on the harmony of the microcosm and the macrocosm, Computus collection including Byrhtferth of Ramsey’s diagram (British Library, Harley MS 3667, f. 8r; The British Library)
The world map itself, while focusing on the inhabited areas of the world, likewise transcends time. As in the French map, emphasis is placed on the peoples who descended from Noah’s sons and populated the earth after the Great Flood. But this topic is now combined with the apostles distributing the Christian message across the world. For example, Athens is said to be the site ‘where St Paul preached’, and Ephesus, ‘where St John preached’. Britain is situated prominently on the outer edge.
The Holy Land in the Peterborough world map
Many labels refer to places in the Mediterranean region. The Holy Land, in particular, takes up a significant portion of the Peterborough map, reflecting its central importance to the Christian story. Included are references to both Old and New Testament events. The division of the land among the tribes of Israel as described in the book of Joshua is especially prominent. Eight of the tribes are named specifically: Asher, Dan, Ephraim, Issachar, Judah, Manasseh, Naphtali and Zebulun.
The city of Jerusalem is positioned between the lands of Ephraim (effraim) and Judah (Terra iuda) and seen as if under a magnifying glass. Jericho is also shown, on the far right. According to Joshua 18:20–28, both Jerusalem and Jericho were positioned in the land of the tribe of Benjamin, which in turn is described in 18:11 as situated between the territories of Ephraim and Judah. While Benjamin is not named on the map, the position of the cities echoes this arrangement.
The word ‘Jerusalem’ is set out in large letters across the horizontal axis usually reserved in T-O maps for the waterways that separate Europe and Africa from Asia. Clearly, this is not a geographical designation here, but rather the consequence of using the most prominent structural component of the map (the horizontal T-bar) as a framing device for the letters. An erased red line just below the horizontal diameter of the map shows that the T-bar was initially more narrow and that the wider band was adopted as an afterthought. This band evokes Ezekiel’s vision of a future division of the land that would contain a sanctified central portion wider than all the tribal territories (Ezekiel 48:8–22). More directly, it proclaims the primary importance of Jerusalem over all other places as the site of Christ’s sacrifice, designated by the inscription crux Christi (Christ’s cross) and an image of a cross. Its significance—and by extension that of the Christian story of salvation, spread by the apostles – is shown to span all space and time.
Mapping the city of Jerusalem
The early 12th century was a critical period in the relationship between Jerusalem and Europe. The earthly city of Jerusalem and its heavenly counterpart occupied a central place in Western thought across the entire Middle Ages. However, with the First Crusade in 1096–99 and the resulting establishment of the Crusader Kingdom of Jerusalem in 1099, Jerusalem became even more present in the minds of medieval Christians. The importance of these developments is particularly evident in contemporary historiography, as the Peterborough manuscript demonstrates. Here, the sparse marginal annals for the years 1096–1100 list just four events: the beginning of the Crusade, the death of Peterborough’s abbot Thorold de Fécamp, the conquest of Jerusalem, and the death of King William II of England (r. 1087–1100). For the monks of Peterborough, the developments in the Eastern Mediterranean were on a par with those of local and national significance.
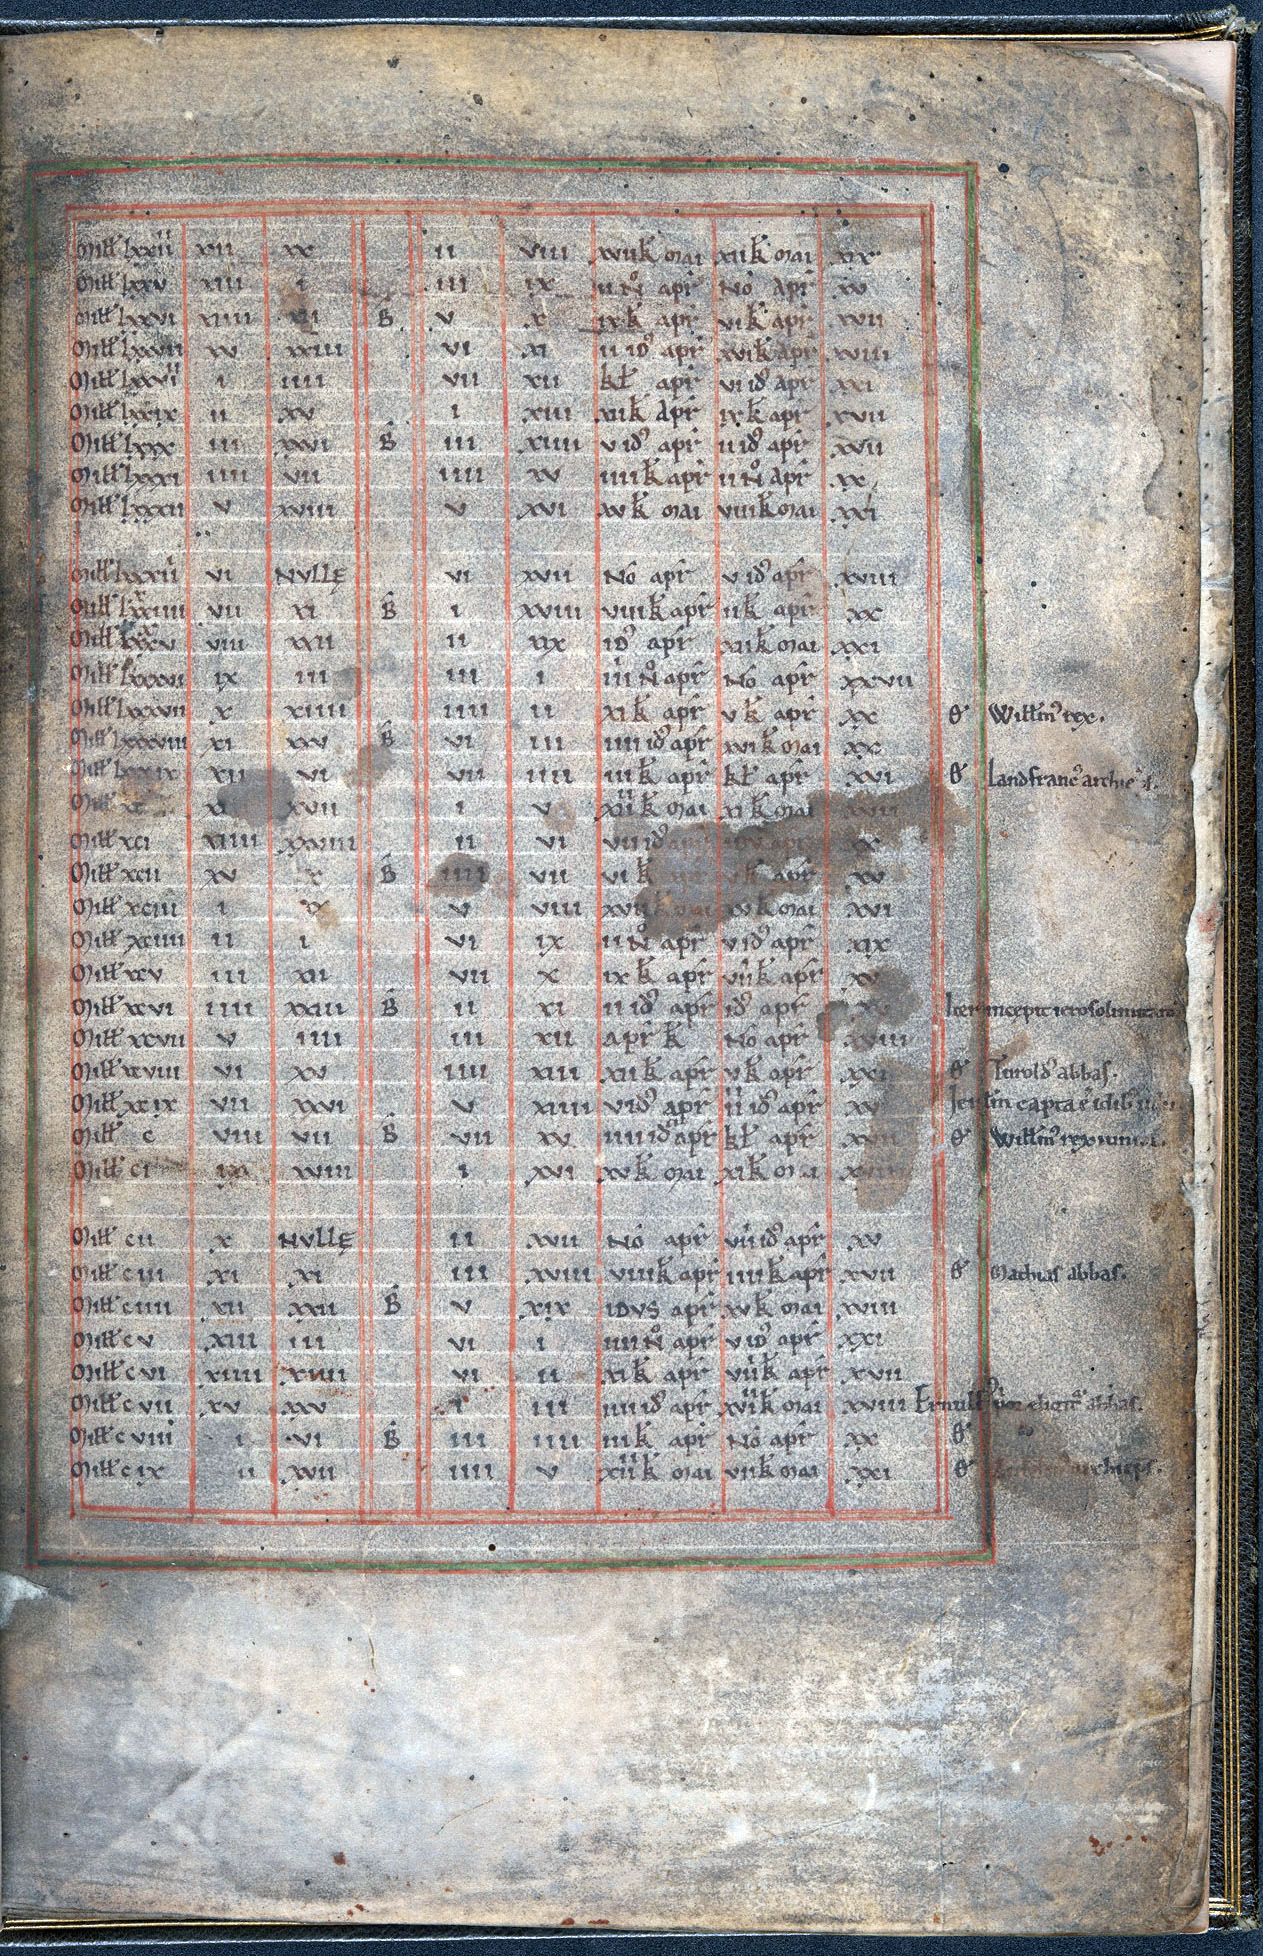
Marginal annals for the years 1096-1100 (rows 24-28) include the conquest of Jerusalem and the death of King William II of England, Computus collection including Byrhtferth of Ramsey’s diagram (British Library, Harley MS 3667, f. 1r; The British Library)
The earliest known Western medieval maps which focus primarily on the city of Jerusalem date from the early 12th century as well. They were made in the Flemish town of Saint-Omer. Demand for copies of this type of map soon extended further afield and also included England. A version of it was added in the second half of the 12th century on a formerly blank leaf of a computus manuscript from the Benedictine abbey of Winchcombe (British Library, Cotton MS Tiberius E IV)—a manuscript which, like the Peterborough manuscript, includes material corresponding to that in the lost computus from Ramsey abbey.
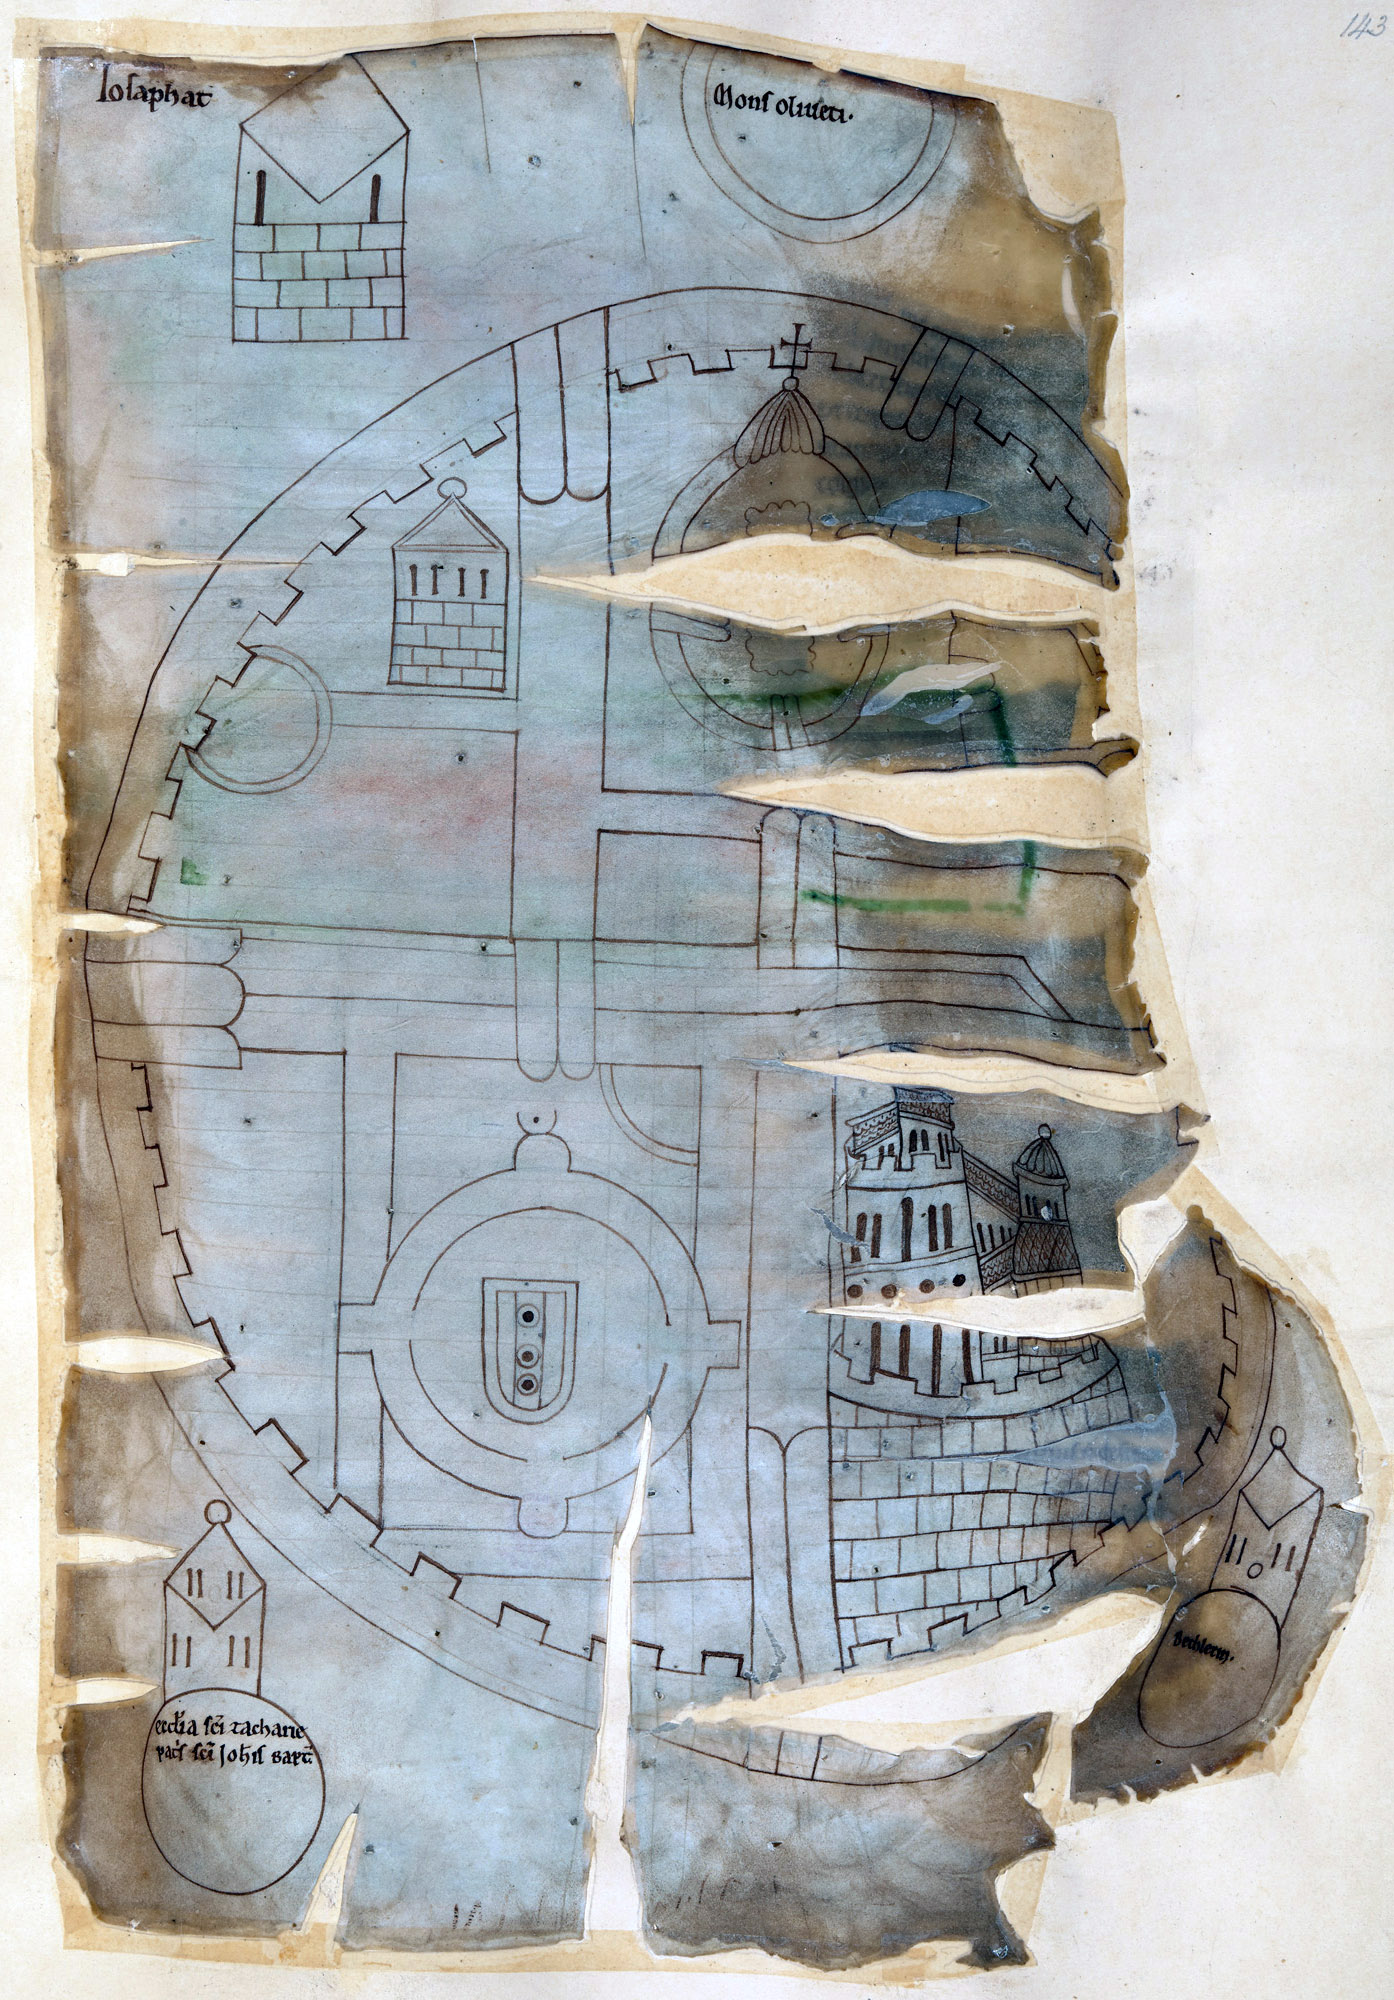
A 12th-century pen-drawn map of Jerusalem, Winchcombe Chronicle (British Library, Cotton MS Tiberius E IV, f. 143r)
The Winchcombe map includes fewer sites than the earlier Jerusalem maps from Saint-Omer, while placing more emphasis on the three most important structures in the city: the Church of the Holy Sepulchre (lower left), the Tower of David (lower right), and the Dome of the Rock (upper center). These buildings show that new information was added to the maps in the copying process. For example, above and behind the Tower of David the Winchcombe map includes a detailed depiction of the adjacent palace of the Crusader kings that had only recently been built (probably in the 1160s).
The basic layout of this type of Jerusalem map is the same in all of its versions. The map is oriented to the East, it is circular and it includes two main roads: one crossing the city from north to south, and another meeting it from the west (the ancient cardo and decumanus maximus). Indeed, these features most probably contributed to the map’s success. Its regular shape projected an image of a city at once real and ideal. This made the map compatible with other cosmological diagrams and maps, including the T-O map already used for centuries as a sign for the world. To a medieval viewer attuned to analogies and concordances between the micro- and macrocosm, this was a potent parallel: just as every T-O map used the shape of the globe to focus on the inhabited parts of the world, so the map of Jerusalem could be seen to convey ideas about the relationship between the city and the world and about its universal significance.